Good morning Guru Community! Welcome to Day 3 of 12 Days of Guru. 


Yesterday's Winner …


Thank you so much for participating and sharing your trust score trends @Sarah W  @brookethebatman @Amanda Labby @Elizabeth Fugikawa @Katelyn Do @Shona Fenner @Anastasia Rybalko @Valerie Renda @Ian Link @Nina Frank @kelly @Alex Avila @Ben Sykes !


 You were all entered in our daily drawing. The winner from Day 2 is …. @Shona Fenner  !!!!!! Shona will get to chose between a $25 gift card or Guru swag. Shona, be on the look out for a message in your email inbox!


What is the 12 Days of Guru?

If you are hearing of 12 Days of Guru for the first time, starting December 1st until our Holiday Deep Dive on December 16th, we'll be dropping a series of tips in the Guru Community to help you recognize your 2021 impact with Guru.

  • Participants will have the chance to win prizes daily by measuring the Guru metric of the day and sharing your findings in the thread. 

  • By the end of the 12 Days, you’ll have all the information you’ll need to complete a Year in Review Card or PDF you can share with your team. 

  • You’ll be able to submit your final Card for a grand prize. 

  • At the Deep Dive, we'll meet to share our wins, mix and mingle, and celebrate before the holidays!

Follow along with these 12 Days of Guru resources and don’t forget to RSVP to the Deep Dive:


Day 3 Challenge!

Who’s ready for Day 3?! Today’s metric of the day is about your total Card views in 2021!

This number will tell us how many times your users referred to information on a Guru Card. 


To measure your total Card views in 2021: 

  1. Web App: Go to the web app (app.getguru.com) and the initial dashboard will display the trust score. You can always return to the dashboard by clicking the 'G' icon in the left hand corner of the navigation bar.DO_+Understanding+Trust+Score.png 
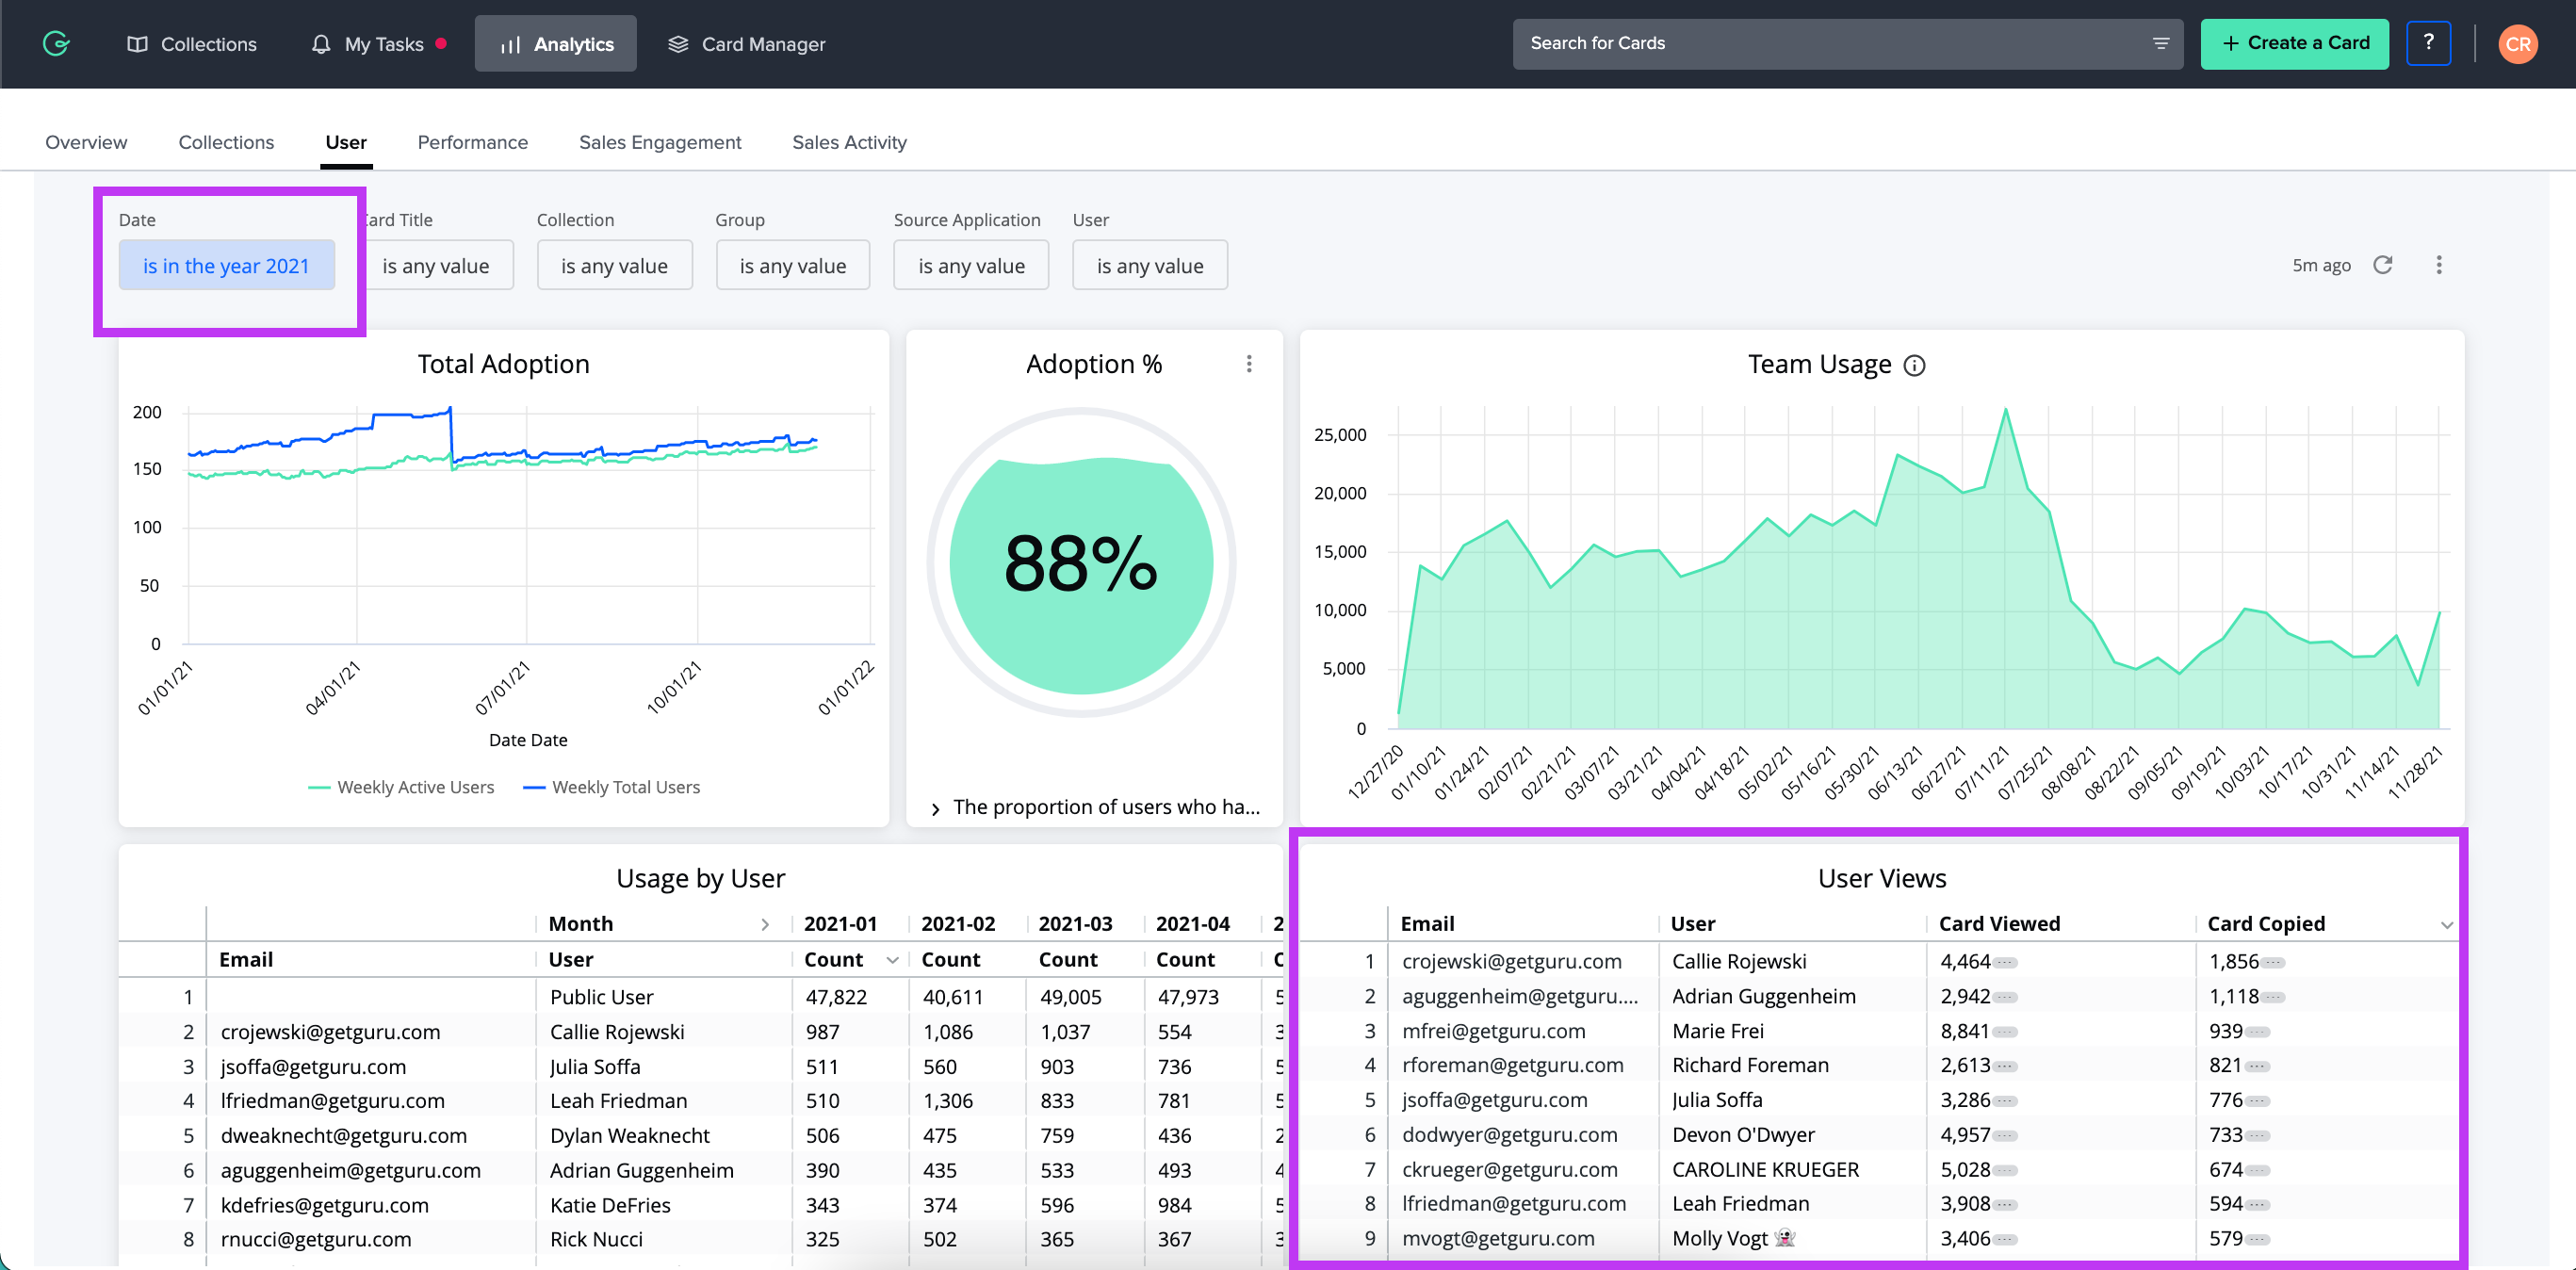
  2. Analytics: Navigate to Analytics in the web app (app.getguru.com/#/analytics) and head to the Users tab. 

  3.   Change the date range to “Is in the year 2021” and refresh your data!
  4. Head to the User Views section and export data (we recommend an excel spreadsheet or CSV).

  5. Open your information up in spreadsheets or Google sheets and calculate the summary of views from each user in 2021!

Watch this Loom video for step-by-step instructions:


What is your # of total Card views for 2021? Share below for the chance to win a $25 Amazon gift card or Guru swag item of your choice! The winner will be announced tomorrow morning with our Day 4 Challenge post. :relaxed:


P.S. New to Guru Analytics? Learn more in this help center article: Getting Started with Guru Analytics

Our total number of views, calculated by adding up views from each Guru user in 2021 is… 585,030.

Curious to see everyone #! Views will range depending on amount of users, what information you have in Guru, how frequently users need that information, etc. Since our Guru users work at Guru, it’s safe to say folks are in there daily. Cool to see how it adds up!


We are sitting at 29871 and I’m actually quite happy with that; especially after looking at our top 10 users by view count!


We have 29,416, which I’m pretty proud of because we implemented in 2021 :) 


So here is something interesting. I cheated (I know!) and just selected all the rows in the modal window, then pasted into a spreadsheet vs actually downloading the export. It seems Amanda and I have the same number of rows but my sum is higher!


Guru is mainly for our Support Team, so filtering to our Frontline Support is 40,191 views! 

Just for fun, I ran it again to account for every single user minus 3 people (myself and 2 other subject matter experts/verifiers because we will skew the numbers), and it was a mind-bogging 93,779 views! 🤯This makes sense since we have every single new hire work in customer support for a month to learn the product and our customers before moving to the role they were hired for, plus all the Light Users that need to see support information. Still impressive to me with ~360 users altogether.


Considering the user count we have, our team is very impressed by the 4,184 card views since we first started in July and didn’t truly build this knowledge base until September of this year. It’s been essential for onboarding new hires and training our salespeople on processes and competitive intelligence. This tool has been so useful to consolidate all of our different sources of information.


I unfortunately can’t pull total # of views or average views (Starter plan!) but around 10% of our Cards have 100 views or more (we have 600 users for context). I’m hoping in the future, and when we have more analytics on the Builder plan, we can figure out what types of content are irrelevant/outdated that can be removed, and figure out what types of content are driving the higher views that might indicate needing more coverage.


We are at 115,799 card views. That is definitely higher than I thought it would be, especially since launching so recently (Aug 26) and having around 1000 employees. Let’s see if we can top it next year :boom:


Our Guru use was limited to around 5 users and specific use cases, and so our total count is 7389. Now that we’re ramping up several new teams and increasing our usage, I’m looking forward to increasing this count a lot in 2022. :sunglasses:


I removed myself from the count (lol)… 

TOTAL VIEWS IN 2021: 38,989
AVERAGE PER USE VIEWS IN 2021: 295


Not bad for under 100 users in our org! 


Our total number of views, calculated by adding up views from each Guru user in 2021 is… 43,137.:grinning:


Wow! We are at 36,784 views! (Somehow, I represent about 7% of that :rolling_eyes: ). We definitely are working on wider adoption and usage next year. 


WOW!! We have 73,514 views which is so cool????


Reply